How to Track Your Local SEO Performance
Track local SEO the right way: measure calls, direction requests, website clicks, and geogrid rankings to prove real revenue growth.
Local SEO advice is always presented in unassuming packaging: set up your Google Business Profile, sprinkle in local keywords, and wait for the rankings to rise. Tracking performance, we’re told, is just a matter of watching a few numbers go up and to the right. But most local SEO tracking fails because it avoids the hardest part: the missing conversion.
Of course, the instinct to avoid it makes sense. Local SEO conversions rarely happen on a website. They happen in phone calls, walk-ins, and drive-bys - places analytics can’t easily reach. So instead of grappling with that complexity, marketers fall back on what’s visible: rankings and impressions.
But visibility isn’t necessarily value. Rankings ignore proximity. And business owners already sense this disconnect.
The fix requires abandoning an outdated tracking model. Local search is no longer static, and performance can’t be measured from a single keyword or location. Modern tracking demands a shift from surface-level metrics to revenue metrics; from what can be easily counted to what actually counts.
TL;DR
- Local SEO isn’t just rankings. Track calls, directions, and website leads.
- Visibility metrics show potential; conversion metrics drive revenue.
- KPIs vary by industry: emergency services > calls; retail > directions; professional > website.
- Use GA4, UTM tags, and geogrid tracking for precise local insights.
- Centralize data to show growth in dollars, not just clicks.
Which Key Performance Indicators (KPIs) Actually Matter for Local SEO?
Local SEO results can be tracked broadly in two ways: visibility metrics and conversion metrics.
- Visibility metrics answer: Are people seeing you?
- Conversion metrics answer: Are people choosing you?
Both matter, but only one pays the bills. Confusing the two and giving them equal weight is where most reporting breaks down.
Visibility Metrics: Necessary, Not Sufficient
These metrics indicate presence. They tell you whether your client appears when someone searches locally. Without visibility, nothing else happens.
But visibility alone proves nothing. They’re definitely an indication of potential, but they do not prove performance.
Search Impressions (Maps vs. Search)
Google Business Profile Insights breaks down how many times your listing appeared in Google Maps results versus in regular search results. This matters because 46% of all Google searches have local intent, and Map Pack visibility drives significantly higher click-through rates than organic results below the fold.
Photo Views
According to Google, businesses with photos receive 42% more requests for directions and 35% more clicks to their websites. Photo views indicate engagement depth. People aren’t just scrolling past; they’re investigating.
Share of Local Voice (SoLV)
This metric quantifies the percentage of local search visibility your client owns versus competitors. If there are 10 relevant local searches daily and your client appears in 7 of them, that’s 70% SoLV.
Research shows that businesses ranking in the top 3 Map Pack positions capture a vast majority of all clicks. Your SoLV number reveals whether you’re winning that battle or losing ground to competitors.
Conversion Metrics: Where Revenue Signals Appear
These metrics directly correlate with revenue. They represent intent-driven actions that signal real customer interest.
Click-to-Call (High Intent)
Someone who taps “Call” from your GBP isn’t browsing; they’re ready to become a customer. For service businesses (plumbers, attorneys, medical practices), calls convert at 10-12x higher rates than website visits.
Track not just total calls, but call source (Maps, Search, website) and call outcome (booked appointment, quote provided, wrong number). This granularity reveals which channels deliver qualified leads versus tire-kickers.
Direction Requests (The Strongest Physical Visit Signal)
According to Google, 76% of people who search for something nearby on their smartphone visit a related business within a day, and 28% of those searches result in a purchase.
A direction request is the digital equivalent of someone walking toward your door. For brick-and-mortar businesses (restaurants, retail, salons), this is your north-star metric.
Website Clicks (Traffic to Local Landing Pages)
Someone clicking through from your GBP listing to your “Plumbing Services in Bronx” page has exponentially higher intent than someone landing on your homepage from a branded search.
Segment and track local landing page traffic separately. These visitors are already qualified by geography and service interest. Your website just needs to close the deal.
How Importance Shifts by Industry
Here’s the critical nuance most agencies miss: Different businesses need different KPIs prioritized.
Plumbers, HVAC, Locksmiths (Emergency Services):
Phone calls are everything. The majority of customers call within 24 hours of needing emergency home services. Track call volume, call duration (under 30 seconds likely means wrong number), and peak call times.
Restaurants, Coffee Shops, Retail:
Direction requests dominate. These businesses live on foot traffic. A 20% increase in direction requests should translate to observable revenue growth. If it doesn’t, the problem is in-store experience, not your SEO.
Professional Services (Legal, Medical, Consulting):
Website clicks matter most because customers research providers online before booking, and conversion happens on the website via contact forms. Your job is driving qualified traffic; their website must convert it.
Read More: What Metrics and KPIs to Track for Your Local Presence
How to Configure Google Analytics 4 (GA4) for Local Traffic
GA4 is powerful. But out of the box, it treats all organic traffic identically. You need a custom configuration to isolate and track local search performance.
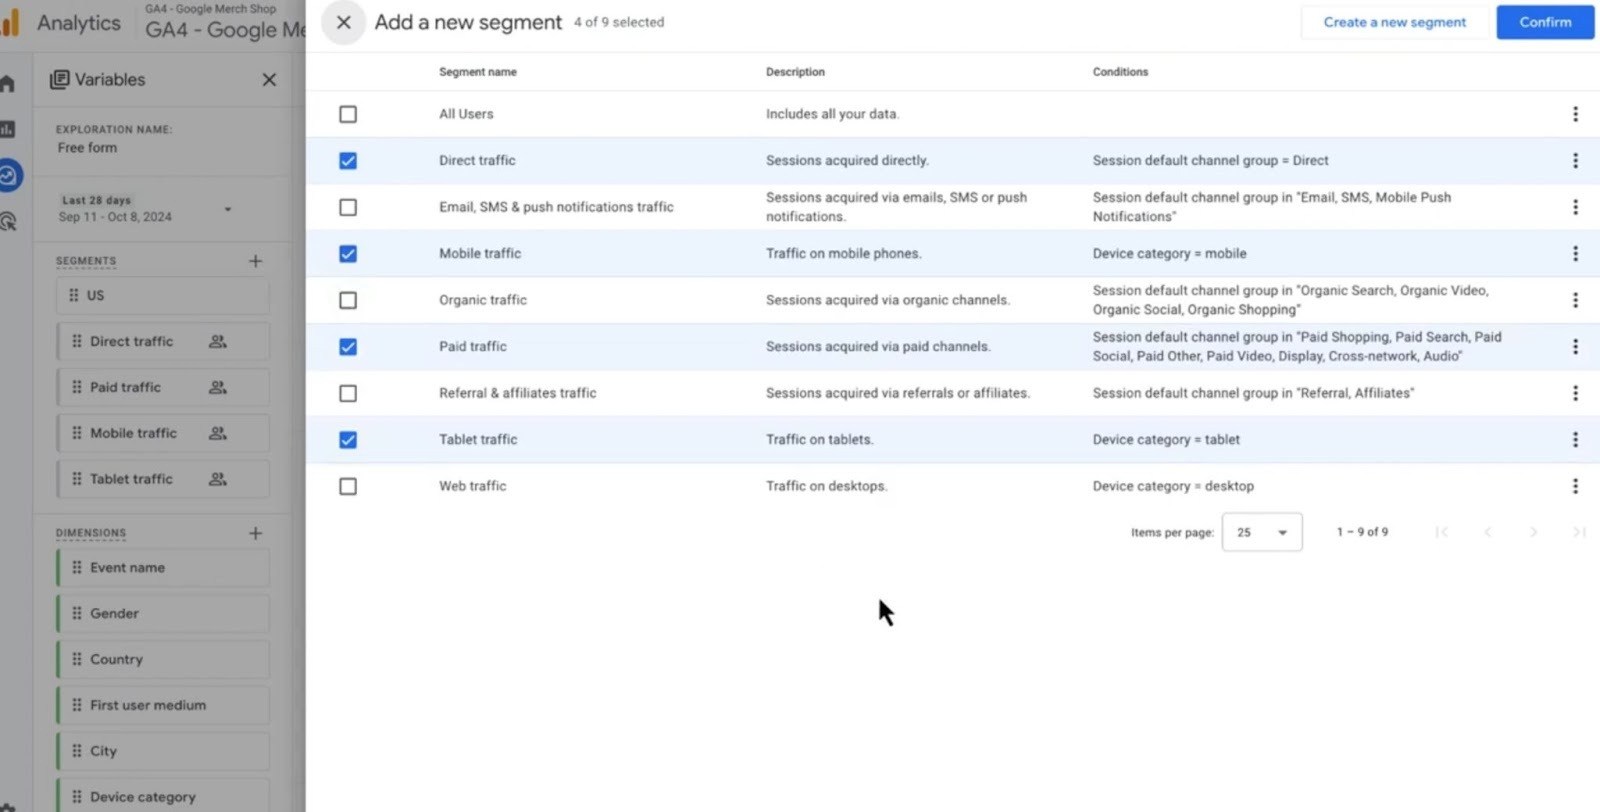
Segmentation
First, separate those visitors who are physically near your client’s business from tourists searching “best [service] in [city]” from across the country.
Step 1: Navigate to Explore > Create New Exploration
Step 2: Add Segment > Create Custom Segment
Step 3: Add Condition: User > Location > City/Region > Contains: [Client's City]
Alternatively, for more precision: Condition: User > Country > United States + User > Region > [State] + User > City > [Target Cities]
This filters your data to show only users within your target service area. Now you’re seeing actual potential customers, not random international traffic inflating your numbers.
Pro Tip: For multi-location businesses, create separate segments for each location’s service radius.
Read More: How to Create and Setup Google Analytics on a Website
Event Tracking
GA4’s event-based model lets you track those specific high-value actions that traditional analytics miss.
generate_lead Event (Contact Form Submissions):
Configure this when someone submits a “Request Quote” or “Book Appointment” form. This event should capture:
- Form location (which landing page generated the lead)
- Lead source (organic/GBP/paid)
- Lead value (if you know average customer value)
click_to_call Event (Mobile Site Calls):
When someone taps a phone number on mobile, fire this event. You’ll need to add onclick tracking to your phone number links.
get_directions Event (Embedded Map Clicks):
If your client’s website has an embedded Google Map, track when users click “Directions”.
These events let you quantify how many website visitors take actions that predict in-person conversions.

UTM Tagging
Here’s the mistake 80% of agencies make: They don’t tag their GBP website link with UTM parameters.
Without UTM tags, GA4 lumps GBP traffic into generic “organic search.” This is indistinguishable from regular Google organic results. You can’t prove that improving your GBP listing drove traffic growth if you can’t isolate that traffic.
The Fix: Add UTM Parameters to Your GBP Website URL
In your GBP dashboard, update the website field to:
https://www.clientwebsite.com/?utm_source=google&utm_medium=organic&utm_campaign=gbp_listing
Now in GA4:
- Navigate to Reports > Acquisition > Traffic Acquisition
- Filter by Campaign Name = “gbp_listing”
- You’ll see sessions, conversions, and revenue specifically from GBP
This single change transforms vague “organic traffic increased” into concrete “GBP-sourced traffic grew 47%, generating 23 new leads last month.”
Read More: Tracking Your Listings and Keywords on Google Search Console with UTM Parameters
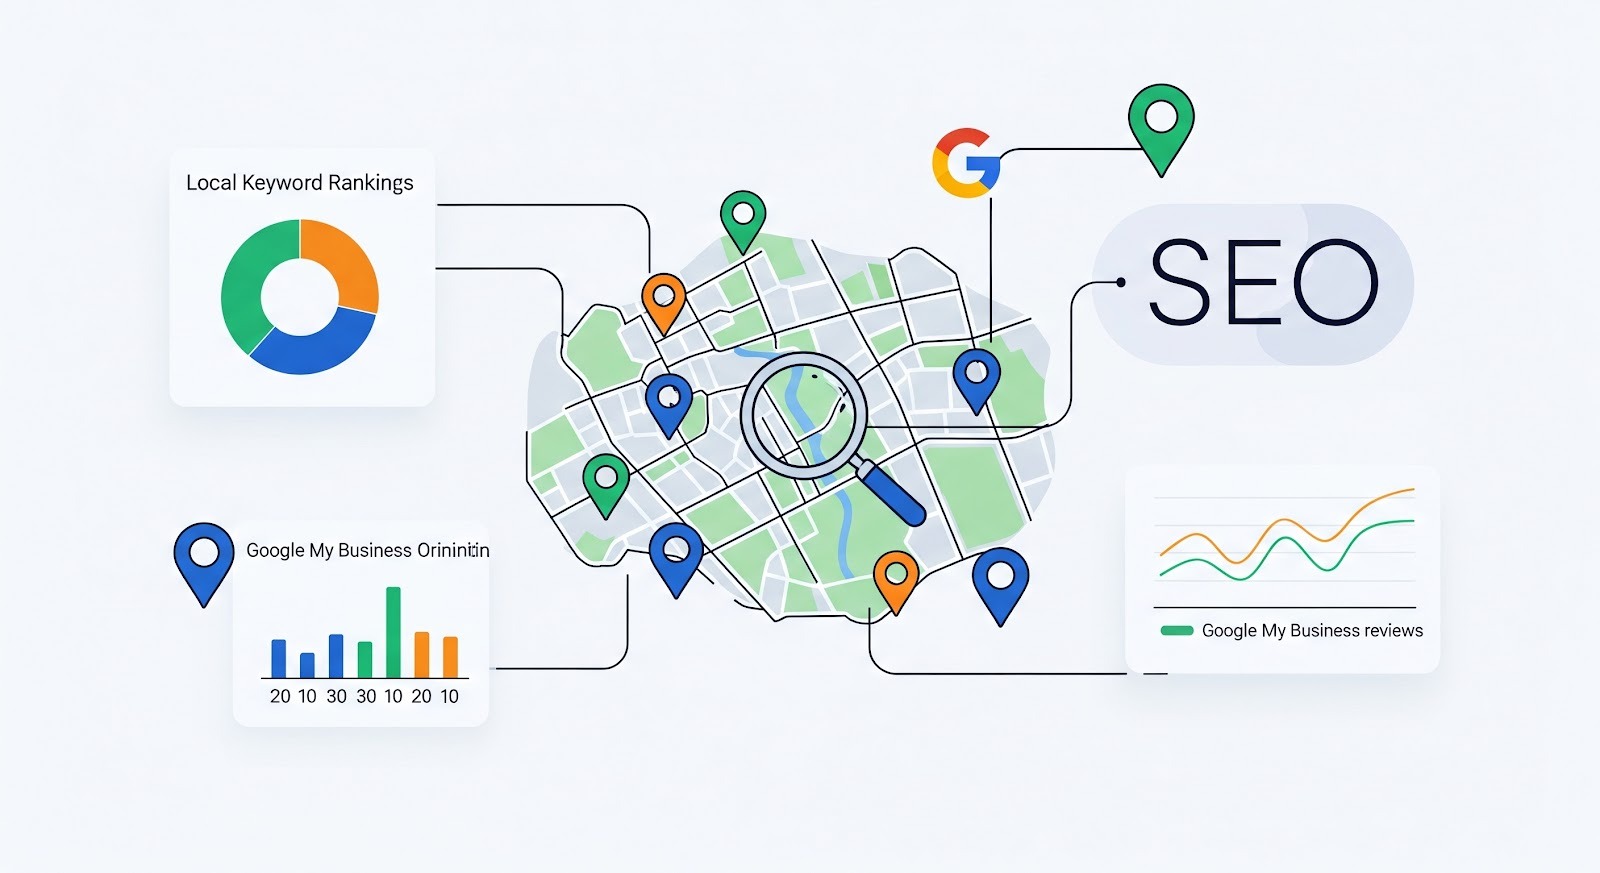
Why Proximity-Based “Grid Tracking” Is Essential
Traditional rank trackers check your client’s ranking from one location, usually their business address. But here’s the problem: Google’s local algorithm prioritizes proximity so heavily that a business can rank #1 at their doorstep and #15 three miles away.
If your client’s ideal customers live in the suburbs 5 miles away, your “Rank #3 in local pack” report is meaningless because it’s measuring visibility from the wrong location.
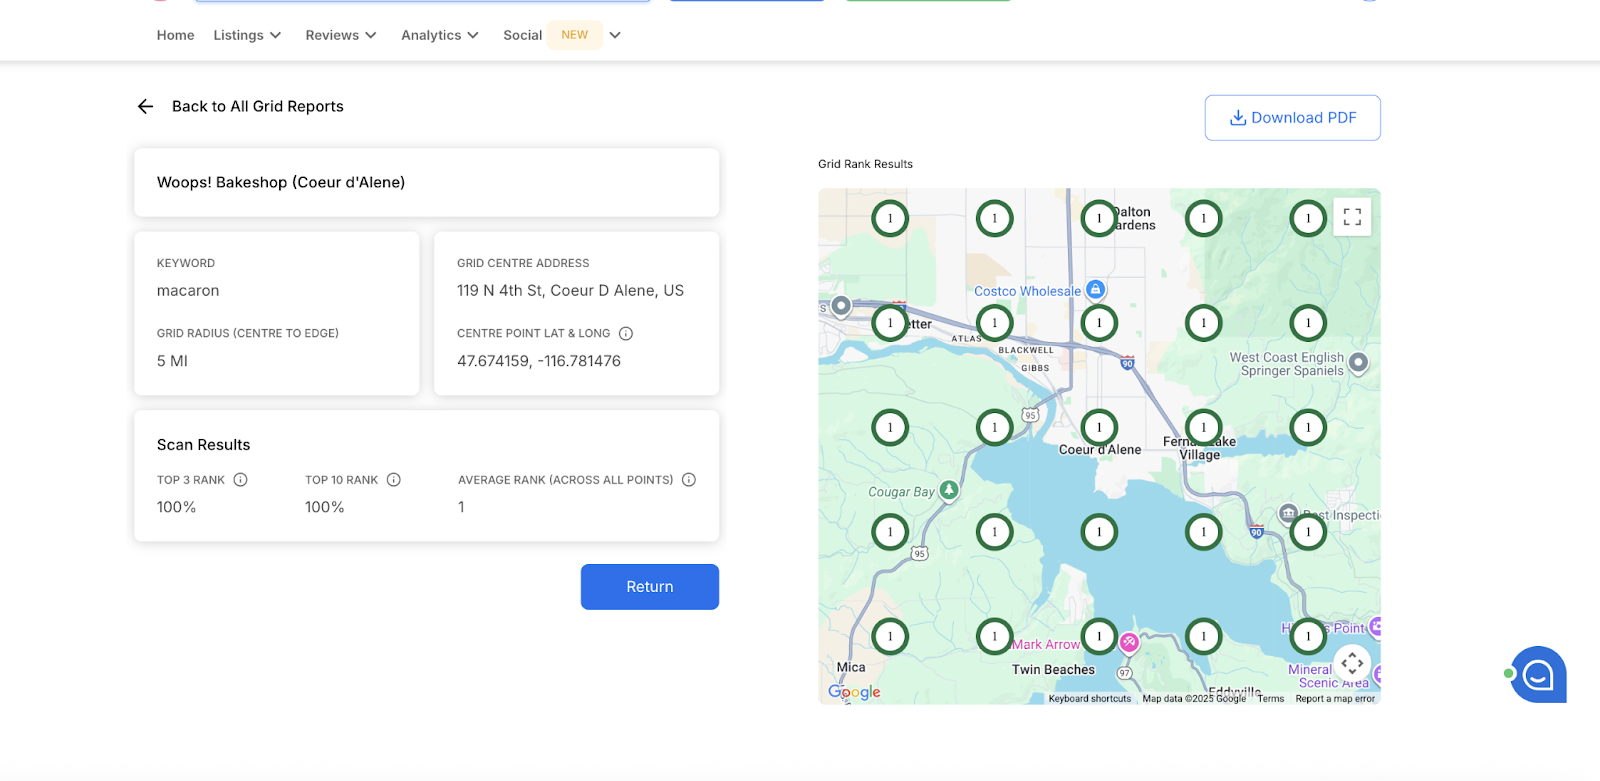
The Grid Concept: Visualizing Rankings as a Heat Map
Geogrid tracking simulates searches from hundreds of locations within a defined radius (1 mile, 5 miles, 10 miles, etc.) and plots rankings on a map. Instead of one data point, you get a comprehensive visibility picture.
How it works:
- Define your target area (e.g., 10-mile radius around the business)
- The tool creates a grid of search points (e.g., every 0.5 miles)
- From each grid point, it performs a local search for your target keyword
- Rankings are color-coded: Green (Top 3), Yellow (4-10), Red (11-20+)
The result: A heat map showing exactly where your client dominates and where they’re invisible.
Synup’s grid ranking tool gives this visualization, letting you track rankings across custom grid sizes and export visual reports that clients instantly understand.
Identifying Drop-Offs and Competitor Strongholds
Grid tracking reveals strategic insights traditional trackers miss:
- Where Visibility Falls Off a Cliff:
If your client ranks well in a 3-mile radius but drops to page 2 beyond that, proximity is the limiting factor.
Solutions: Open a second location, use service area business (SAB) designation more strategically, or focus content on neighborhoods where visibility is weak.
- Competitor Geographic Dominance:
Grid tracking shows where competitors outrank you. Maybe a competitor dominates the north side of town while you own the south. This intel informs:
- Targeted Google Ads campaigns (bid higher in weak zones)
- Review generation focus (request reviews from customers in underperforming areas to build local relevance signals)
- Content strategy (create neighborhood-specific landing pages for weak zones)
- Seasonal/Event-Based Shifts:
Run grid scans monthly to detect ranking shifts. Did a new competitor open 2 miles away and crater your visibility in that zone? Did a major review influx boost your suburban rankings? Grid tracking catches these changes that single-point rank checkers miss entirely.
How to Accurately Track Calls and Offline Conversions
Digital analytics end where offline conversions begin. For local businesses, this gap is critical because most revenue comes off-screen.
Call Tracking Software: Attributing Calls to Channels
GBP shows total calls, not which marketing channel drove each call. Did they find you via Maps? Organic search? Paid ads? Without attribution, you’re guessing.
The Solution: Dynamic Number Insertion (DNI)
DNI tools assign unique phone numbers to different traffic sources. For example:
- GBP listing: (555) 123-0001
- Organic website visitors: (555) 123-0002
- Paid ads: (555) 123-0003
When someone calls any number, the system logs the source. Now you know exactly which channel generated that $2,500 HVAC job.
What to Track Beyond Call Volume:
- Call duration
- Call outcome
- Peak call times
- First-time vs. repeat callers
Also Read: Using Call Tracking Number for Google Using Synup
GBP Call History: Using Native Tracking
GBP provides basic call tracking under “Performance > Calls.” You'll see:
- Total calls by date
- Call origin (Maps, Search, other)
- Approximate call duration
The limitations:
- Google masks caller numbers for privacy (you can’t see who called)
- No call recording or outcome tracking
- Can’t distinguish first-time vs. repeat callers
- Delayed reporting (data lags by 2-3 days)
For high-volume businesses or those with long sales cycles, native GBP tracking isn’t enough. But for small businesses just starting local SEO tracking, it’s a free starting point that beats no data.
Google Ads “Store Visits”
If your client runs Google Ads, the Store Visits metric estimates how many ad clicks resulted in physical store visits. Google uses anonymized location data from users who’ve enabled Location History.
The catch: Only available if:
- Running Google Ads
- Business has physical locations
- Receives significant daily traffic
- Users opt into Location History (not all do)
When it’s available, Store Visits data is gold. It directly connects ad spend to foot traffic. But most small local businesses don’t meet the threshold.
Alternative: Coupon/Promo Code Tracking
Create unique promo codes for different channels. When customers redeem codes, you’re tracking offline conversions manually but accurately. Simple, old-school, effective.
How to Monitor Visibility in AI Overviews and Voice Search
As search shifts to AI-generated responses, the way we measure visibility must evolve alongside it.
Tracking “Mentions” vs. “Ranks” in AI Search
Search behavior is evolving again. In AI-generated responses (Gemini, ChatGPT, Google AI Overviews), you don’t “rank #3.” You’re either cited or not. Such mention-based visibility requires different tracking.
Instead of asking, “Where do we rank?” the question becomes, “Are we mentioned in AI answers?” Instead of measuring CTR alone, you measure inclusion frequency and sentiment.
Search variations of “[service] near [city]” in Google/ChatGPT. See if your client appears in the generated response. Also, monitor whether the AI cites your website, GBP listing, or third-party reviews as its information source.
The Long-Tail Conversational Query Shift
Voice search and AI chat favor natural language queries over short keywords. Instead of “plumber Chicago,” users ask: “Which plumber near me can fix a leaking water heater today and accepts emergency calls?”
This changes your tracking strategy as you need to track long-tail conversational queries too.
How to identify long-tail opportunities:
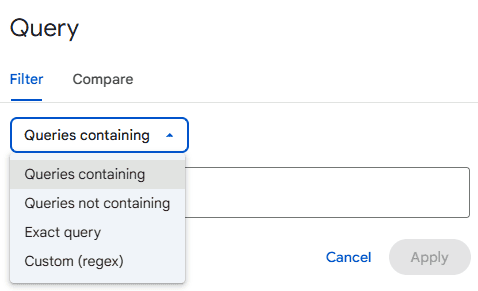
- Check Google Search Console → Queries → Filter by question words (who, what, where, when, why, how).
- Look for queries with 8+ words that generated impressions but low clicks.
- Create content answering these specific questions.
Also Read: Local SEO in 2026 - Everything You Need to Know
How to Centralize Data and Avoid “Dashboard Fatigue”
Most agencies operate in a state of local SEO reporting chaos. GBP in one tab. GA4 in another. Call tracking software in a third. Rank trackers in a fourth. All just to compile one monthly report.
This fragmentation doesn’t just waste time. It hides causation.
Unified dashboards like that from Synup centralize visibility, engagement, calls, reviews, and geographic rankings into one narrative. When review volume rises alongside Map impressions and call volume, the relationship becomes visible. When grid coverage expands, and direction requests follow, strategy proves itself.
Correlation becomes comprehension. And comprehension is what clients pay for.
Also Read: Do More with 11 Local SEO Automation Tools and Strategy
Summing Up
Local SEO tracking has evolved far beyond “Check if we’re ranking #1.” Modern tracking requires:
- Geographic precision over single-point rankings.
- Offline conversion attribution over impression counts.
- Channel-specific insights.
- Industry-specific KPIs over generic dashboards.
- AI and voice visibility.
Set up geogrid tracking, configure GA4 to isolate local traffic and actions, implement call tracking, and centralize everything into a unified dashboard with Synup that tells a coherent story.
The goal is to show that growth occurred, rather than higher activity.
When you can say, “Your local SEO generated 47 new customers worth $73,000 last quarter,” the invisible ROI problem disappears.
And that’s the report that gets contracts renewed.
Also Read: Top 15 White Label Local SEO Tools
FAQs
- What’s your go-to way to show ROI for local SEO clients?
Track high-intent conversions that drive revenue (calls, direction requests, and local landing page clicks) using GA4, UTM-tagged links, and call tracking. Combine this with geogrid ranking insights and a unified dashboard to prove growth in dollars, not just clicks.
- How to check SEO locally?
Use proximity-aware tracking tools like geogrid rank trackers or local search simulators. Use GA4 custom segments, event tracking, and GBP insights to measure both visibility and conversions from your actual service area.
- What is the best tool for tracking local SEO rankings?
Tools like Synup have geogrid tracking, competitor visibility, and multi-location reporting far more accurate than single-point rank trackers. Pair these with GA4 and call tracking for a complete local SEO performance picture.