Complete Guide to Agency Profitability for SEO Agencies
Learn how marketing agencies boost profit margins from 15% to 30%+ using the right metrics, pricing models, and operational systems.
For many marketing agencies, revenue growth looks impressive on paper. New clients are signing, the team is expanding, monthly revenue keeps climbing, and the dream is looking more feasible.
Yet many founders still struggle to get answers to one critical question: Are we actually profitable?
According to industry benchmarks, the average digital marketing agency operates at roughly 15% net profit margin. That means for every $100,000 in revenue, only about $15,000 remains as profit after expenses.
That margin can disappear quickly when inefficiencies creep in. Even a few hours of unbilled work or excessive tool subscriptions can quickly wipe away the profits. Agencies can appear busy and successful while their finances become increasingly fragile.
It’s a simple reality: revenue growth doesn’t automatically mean profit growth. Profitability is an operational outcome, a result of disciplined pricing and clear visibility into how resources are used.
This guide explores how modern marketing agencies improve profitability by tracking the right metrics and building systems that protect margins at every stage of growth.
TL;DR
- Revenue growth does not equal profit growth.
- Healthy agencies track metrics like gross margin, utilization rate, revenue per client, and contribution margin per service.
- Industry benchmarks show healthy agencies operate between 15 to 25% net margins.
- Pricing models significantly influence profitability. Productized retainers often outperform hourly billing.
- Operational efficiency and standardized delivery improve margins.
- Consolidating tools and centralizing data gives agencies better visibility into profitability.
What Agency Profitability Really Means
Agency profitability refers to the financial gain remaining after deducting all operating, delivery, and overhead costs from total revenue.
In simple terms:
Profitability = Revenue - Costs
Here's a number to start with:
The average digital agency has earned a net margin of about 15% since 2015, according to Promethean Research.
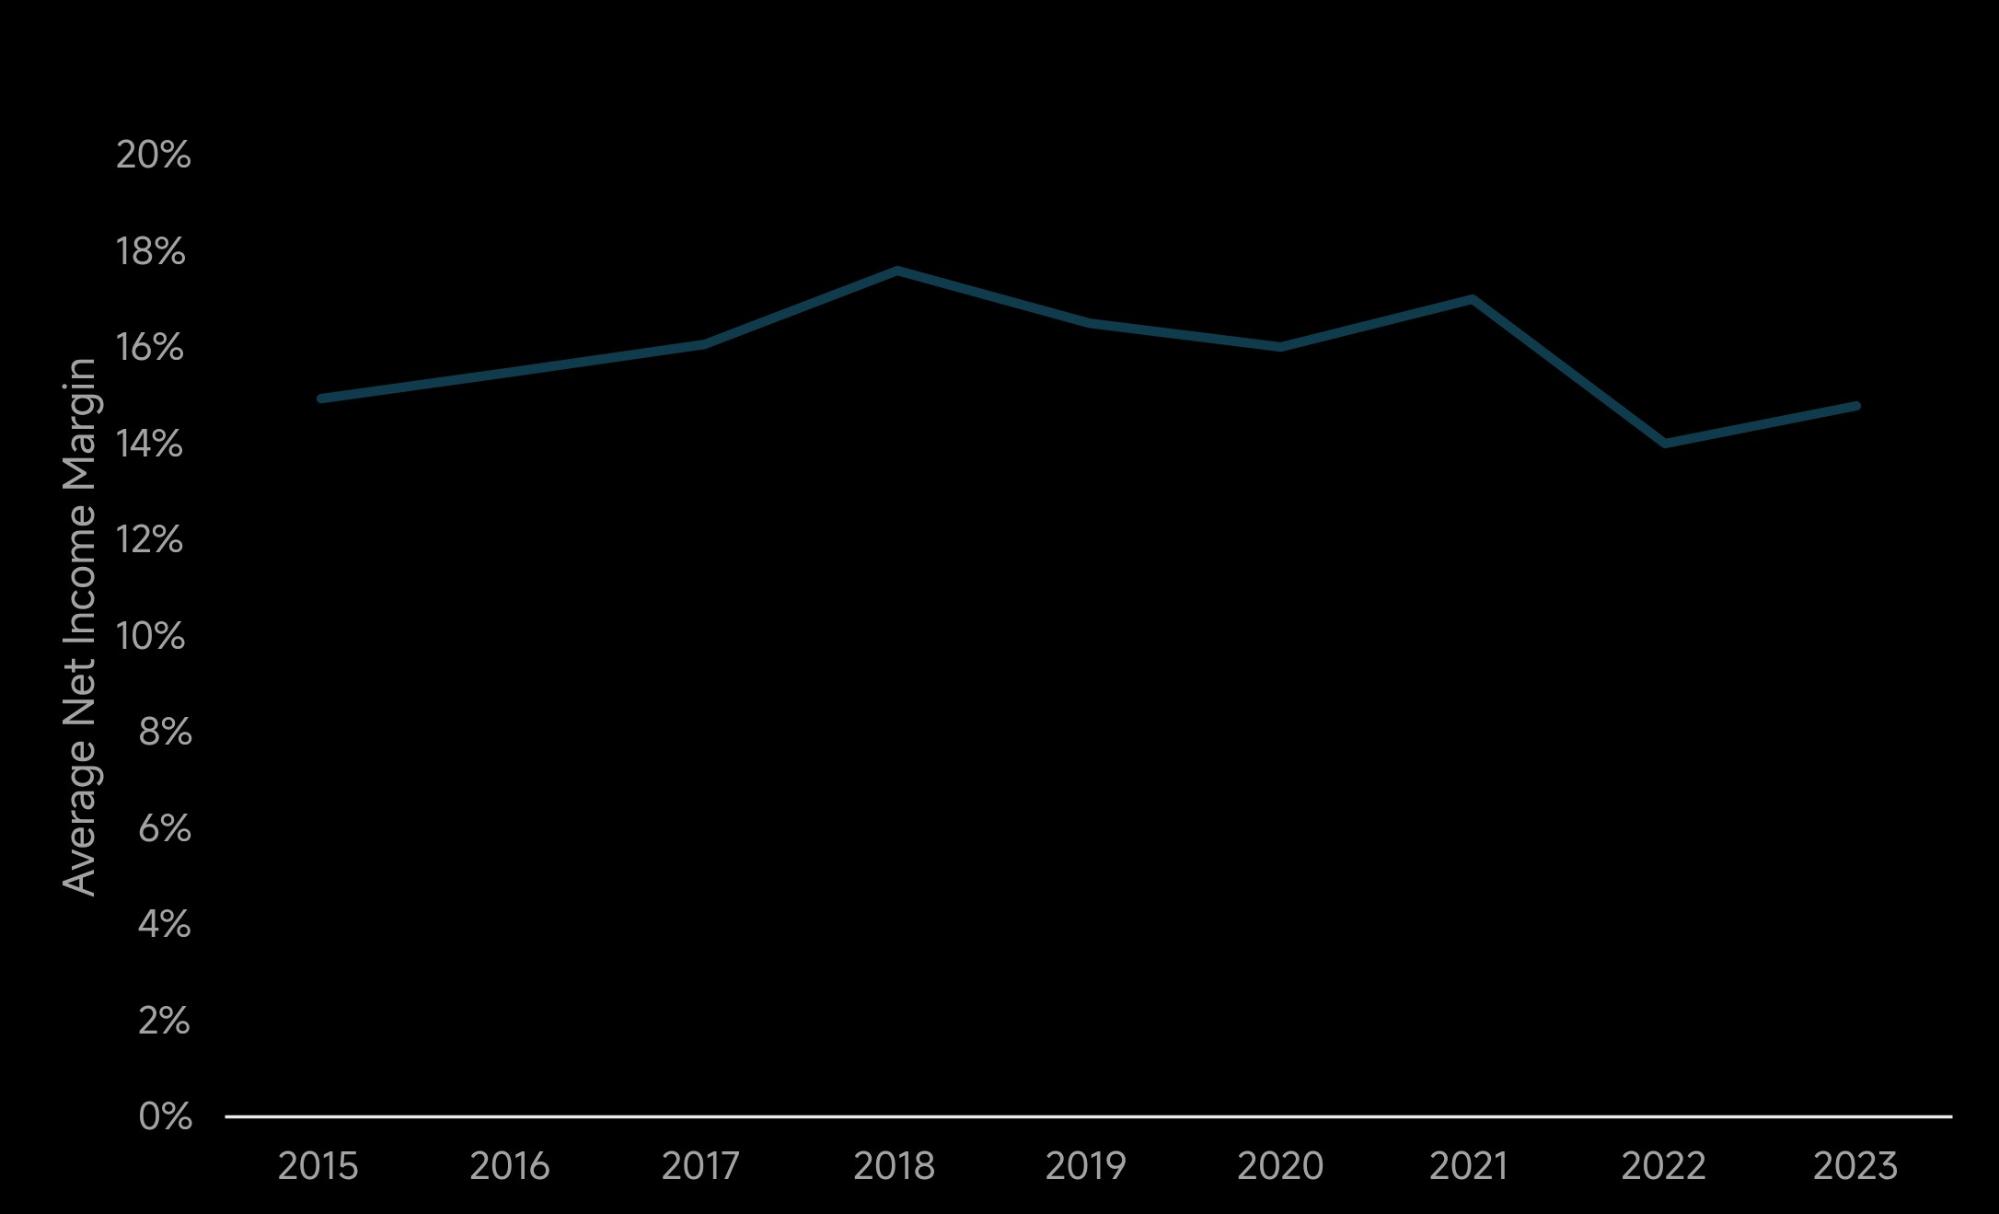
Source: Promethean Research
Revenue vs. Gross Margin vs. Operating Margin
- Revenue is the total amount clients pay for services. It represents the top line of your business.
- Gross margin measures profitability after subtracting the direct costs of delivering services, such as team salaries, freelancer fees, production costs, and tools used for client delivery. Healthy agencies often target 50 to 60% gross margins.
- Operating margin accounts for all additional overhead costs, including office expenses, marketing, administrative staff, insurance, and general software. A strong operating margin typically falls between 15% and 25%.
Understanding these layers helps agency founders identify where profitability is truly created or lost.
Core Profitability Metrics Every Agency Must Track
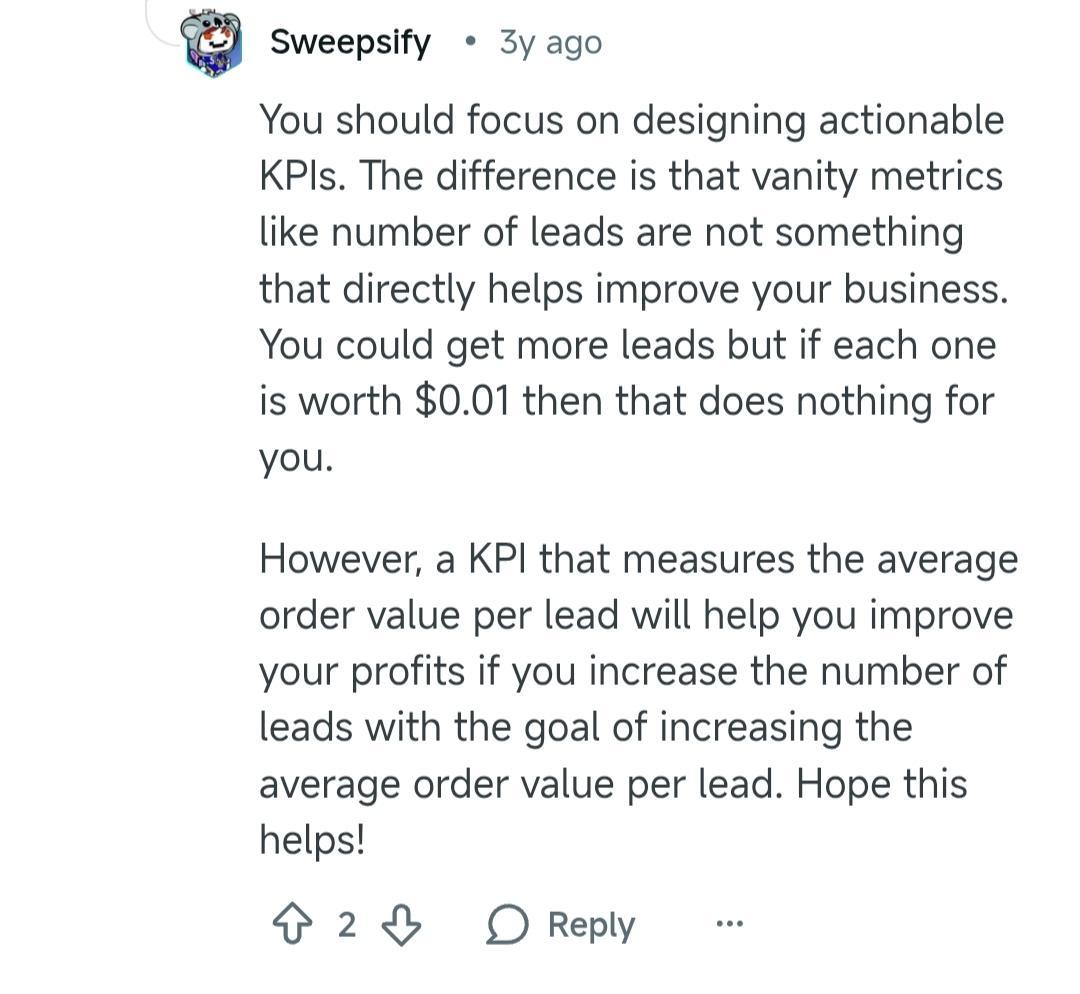
Before going into the metrics, consider this perspective from an agency owner:
Source: Reddit r/agency
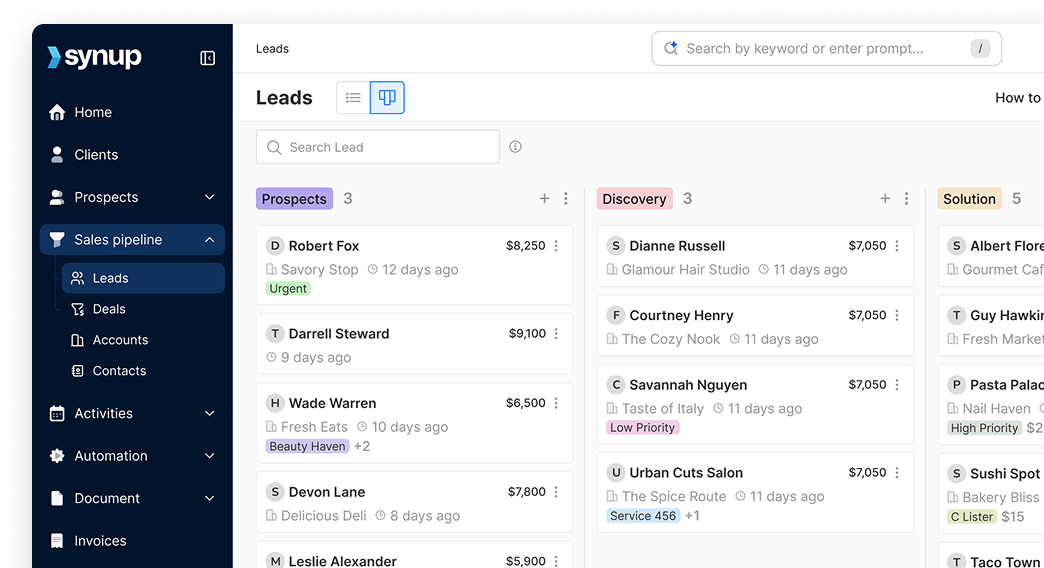
The point is valid. The KPIs that actually matter are the ones that connect activity to profit. A metric that tracks average revenue per lead, for example, helps you focus on quality over volume. It gives you something to improve against.
Here are the metrics that profitable agencies track obsessively:
Gross Margin
Gross margin measures how efficiently services are delivered. It is the most fundamental health check for any agency.
Here is the formula:
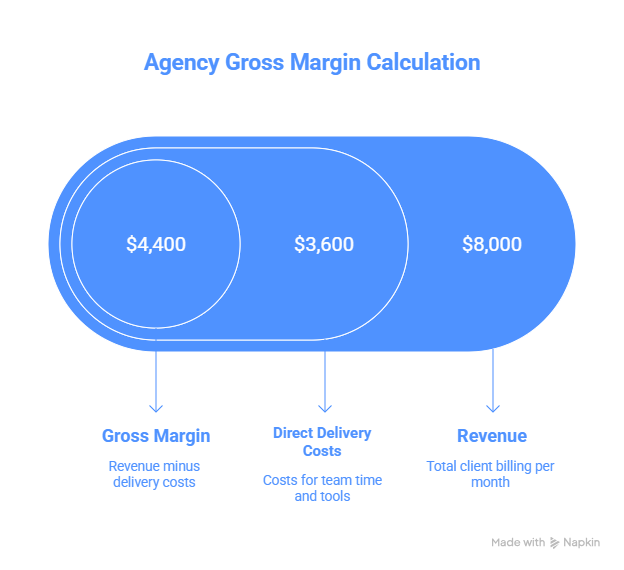
(Revenue - Direct Delivery Costs) / Revenue x 100
For Example:
If an agency bills $8,000 monthly and delivery costs are $3,600, your gross margin is 55%.
Margins below 50% usually indicate underpriced services, inefficient workflows, and excessive delivery time.
Utilization and Realization
Utilization measures how much of a team’s working time is spent on billable work. The healthy benchmark is 65 to 80%. Below 60% indicates an underutilized team, while above 85% a great burnout risk.
High-performing agencies carefully balance workload to maintain both efficiency and team sustainability.

Realization measures how much delivered work is actually billed to clients. For example, if a team spent 40 hours completing work on a project scoped for 30 hours, realization drops to 75%. That missing 25% directly reduces profitability.
Revenue per Client
Revenue per client shows whether agencies are building valuable client relationships or accumulating low-value accounts.
A typical SMB agency may charge $100 to $200 per location per month. If a client has 3 locations, monthly revenue might range between $300 to $600. The key question becomes: Does that revenue justify the required delivery effort?
Cost per Account
Cost per account calculates the full expense of servicing one client. Costs typically include team time, freelancer expenses, software allocations, and operational overhead. When the cost per account approaches client revenue, profitability quickly disappears.
Contribution Margin per Service
Not every service generates equal profit. For example, an agency’s social media management might run at a 60% margin, while its custom web design work barely scales to 20%.
Understanding these differences helps agencies prioritize high-margin services.
Why You Need to Reject Fragmented Data in Your Agency
Many agencies rely on disconnected systems such as CRM platforms, project management tools, accounting software, and reporting dashboards. When data lives across multiple tools, calculating profitability becomes time-consuming and error-prone.
Centralized platforms like Synup OS consolidate client data, delivery metrics, and billing information in one place, making profitability easier to track.
Industry Benchmarks: What “Healthy” Looks Like
Industry benchmarks help agencies understand whether financial performance is competitive.
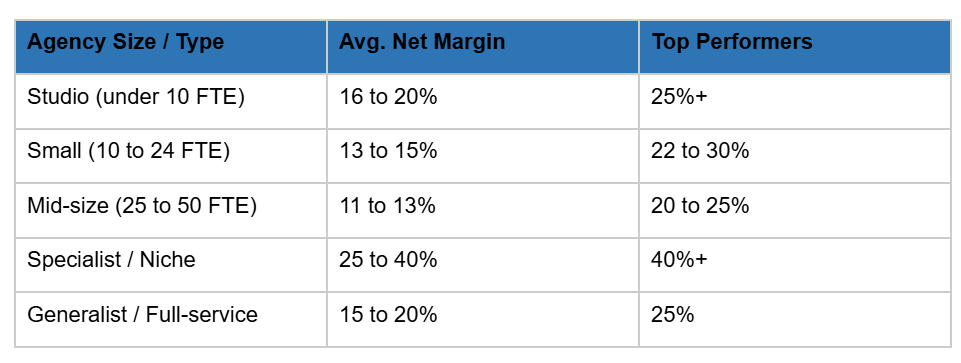
Sources: Promethean Research 2024, TMetric Benchmarks 2025, Predictable Profits 2025
Two trends emerge consistently here. First, margins often shrink as agencies scale due to increased operational complexity. Secondly, specialized agencies tend to outperform generalist ones because niche expertise allows them to charge premium prices.
Benchmarks should guide strategic decisions, and not dictate them. A 14% margin might be excellent if you are aggressively reinvesting in growth. A 22% margin might be mediocre if half your team is idle.
Pricing Models and Their Impact on Margins
Pricing structure is one of the most powerful drivers of agency profitability. The wrong structure can quietly bleed your margins even when revenue looks healthy.
Hourly vs. Retainer vs. Packaged Pricing
- Hourly pricing ties revenue directly to time spent. While simple, this creates several limitations. Efficiency reduces billable hours, scaling becomes difficult, and revenue becomes unpredictable.
- Retainer pricing is better. It provides a consistent monthly revenue, where clients pay a fixed monthly fee for ongoing services. Agencies using retainer models report margins roughly 20% higher than those using project-based billing.
- Packaged (productized) pricing is best for scaling. It defines standardized service packages and produces the most stable margins. This results in easier sales processes.
Why Custom Pricing Hurts Profitability at Scale
When every client has unique pricing, delivery becomes inconsistent. You cannot predict costs. And you certainly cannot see which services actually make money.
With custom pricing comes complex operations and, hence, inefficient workflows. But standardization helps agencies scale profitably.
How Scope Creep Silently Kills Margins
Research from Ignition found that 57% of agencies lose $1,000 to $5,000 per month to unbilled scope creep. Only 1% manage to bill for all out-of-scope work.
Scope creep is not about bad clients. It is about unclear contracts. When a signed agreement states “social media management” instead of “12 posts per month across two platforms with one revision round,” you leave the door open for unbounded work.
Cost Structure: Where Agency Margins Are Won or Lost
Revenue alone does not determine profitability. The other half is the cost of earning that revenue. Let us break down the three biggest cost drivers for agencies.
Labor: The Biggest Line Item
For most agencies, salaries and contractor costs eat 40 to 60% of revenue. That is normal, but small labor inefficiencies can compound quickly.
For example, if a content writer (who costs $30 per hour) spends two hours monthly on admin work per client, that is $60 per client per month in non-productive labor. Across 30 clients, that is $1,800 monthly and $21,600 annually. On admin work, alone!
The fix is not to hire cheaper people. It is to remove the friction that wastes their time.
Tool Sprawl and Hidden Software Costs
The average agency uses over 12 tools to complete a typical job. Each one costs $50 to $300 per month. Promethean Research puts the average tool spend at 3.7% of revenue.
Modern agencies rely on many software tools, and these multiple subscriptions can quickly exceed 3-5% of revenue. Consolidating tools into one sophisticated OS reduces both costs and operational friction.
Over-Servicing Clients
Providing more service than clients pay for is a common profitability issue.
If a client pays for 10 hours of work but consistently receives 14 hours, the agency effectively gives away 40% of its value. Multiply that across several clients, and that’s a serious margin problem disguised as good service.
The solution is not to deliver less. It is to clearly define the client’s scope and structure.
Also Read: Ultimate Guide to Agency Project Management: Save Time & Scale Efficiently
Operational Efficiency as a Profit Lever
You cannot optimize your way out of bad pricing. But you can absolutely waste good pricing with bad operations.
In fact, high-performing agencies rely on systems rather than heroics, and profitability only improves when operations become repeatable.
Process Consistency
When your best account manager delivers an amazing client experience because they personally remember every detail, that is great. Until they take a vacation, or leave, or get sick. Then everything falls apart.
Standardized workflows ensure consistent service delivery. They build processes that anyone on the team can follow and deliver consistent quality results.
Also Read: How to Automate SEO Workflows with AI Tools
The Cost of One-Off Client Setups
Every time you onboard a client differently, you create a unique workflow that no one can template, train, or improve at scale. The first custom setup takes 5 hours. The next one takes 5 hours too. You never get faster because every project is different.
Standardized onboarding workflows let you cut setup time dramatically. Instead of starting from scratch each time, your team follows a proven checklist.
How Agency Operating Systems Protect Margins Day to Day
As agencies grow, operational complexity quickly increases. What starts as a simple workflow often evolves into a large fragment of tools and processes. Each additional tool not only adds a new subscription fee, but it also introduces more data, which forces teams to switch constantly between platforms.
Over time, this fragmented stack increases the time required to complete routine work and leads to tool sprawl.
This is why many growing agencies eventually shift toward agency operating systems that consolidate core functions into one unified platform.
How Consolidation Improves Profitability
- Lower Software Costs: Consolidating multiple tools into a single platform reduces the total subscription costs agencies pay across their technology stack.
- Faster Workflows: Centralized dashboards reduce the time lost switching between platforms, allowing teams to manage client delivery and reporting more efficiently.
- Better Profitability Visibility: When client data and performance metrics live in one system, agencies gain clearer insight into margin performance across clients and services.
Platforms like Synup OS illustrate this approach by combining capabilities such as listings management, review monitoring, automation, and reporting within a single environment.
By reducing tool sprawl and lowering the operational cost required to serve each client, agencies can protect their margins while continuing to scale their services.
Packaging, Plans, and Margin Expansion
Service packaging is one of the most effective ways to improve agency profitability. Most agencies know their total revenue but can’t tell which services generate the most profit. Without such information, strategic decisions end up becoming guesswork.
Why Packaging Reveals Hidden Margins
When you group services into defined packages (e.g., Basic, Growth, and Pro), two things happen.
First, you standardize delivery. Every client on the Growth plan gets the same scope, tools, and onboarding flow. That means predictable costs.
Second, you can measure profitability by plan, not just by client. If your Growth plan runs at 55% gross margin but your Pro plan only hits 35%, you know exactly where to focus your attention.
Synup OS Plans Builder
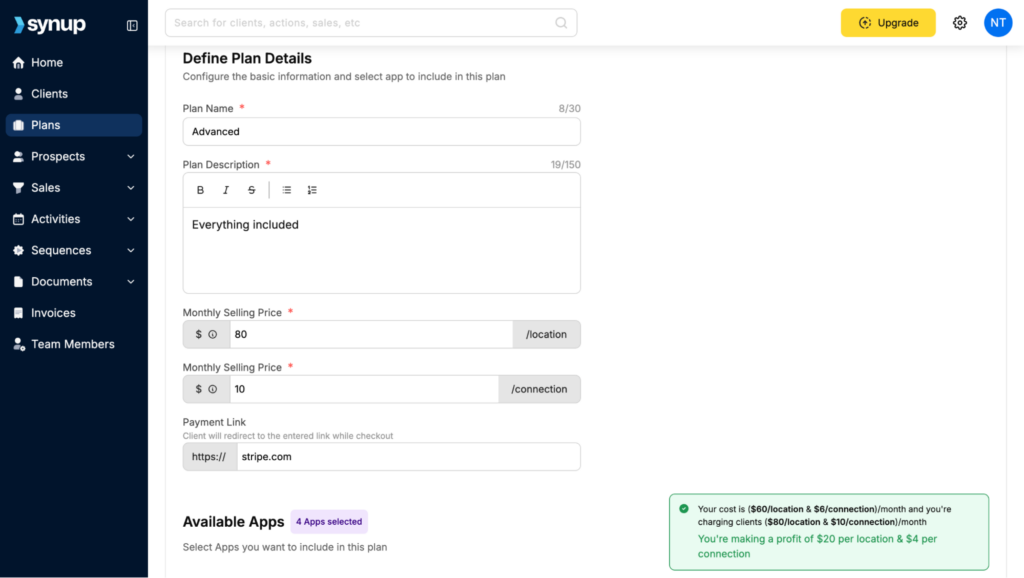
Source: Synup
The Plans Builder in Synup OS lets you bundle marketing apps and services into defined plans. Each plan includes specific tools (listings, reviews, social, SEO), a set pricing tier, and a clear delivery scope.
This means your sales team can sell from a menu. Your ops team knows exactly what each plan requires. And you can pull margin reports by plan to see where your money is actually made.
Profitability at Different Stages of Agency Growth

Early-Stage Agencies: Underpricing and Overdelivery
Early agencies are often sorely tempted to underprice their services to win more clients. This approach may build a client base but usually leads to overwork and thin margins.
The pattern looks like this: you win clients at $150 per location. You give them $300 worth of service. You work 70-hour weeks. But the bank account never really grows.
So, how to avoid this trap? Track your delivery time and raise prices early,
Scaling Agencies: Margin Erosion From Complexity
As agencies reach 15-30 employees, complexity increases. This is the stage where tool sprawl accelerates, process exceptions multiply, and managers spend more time coordinating than doing. Margins erode not because of any single problem, but because of a hundred small ones.
The fix here is consolidation and standardization. One operating system instead of seven point solutions. One onboarding flow instead of a different setup for each client.
Mature Agencies: Optimization and Consolidation
With 30+ employees, your biggest opportunities are in the details. Renegotiating vendor contracts. Trimming underperforming services. Building self-service portals that reduce support load.
This is when an operating system like Synup OS becomes essential. Not as a nice-to-have, but as the infrastructure that keeps margins visible and manageable at scale.
Also Read: Find the Ideal Marketing Agency Structure: 7-Step Guide & Best Practices
Visibility: The Missing Link in Most Agencies
Ask most agency founders which of their clients are profitable, and you will get a pause. Then something like “our bigger accounts, probably.”
Probably is not a strategy.
The danger of flying blind on margins is that problems compound silently. A client who loses you $200 per month does not trigger alarm bells. But 10 clients like that cost you $24,000 per year.
Centralized Visibility Across Clients, Locations, and Services
This is where the Client Summary feature in Synup OS makes a real difference. It consolidates every client’s data into one view: service usage, activity levels, product adoption, churn risk, and performance metrics.
Combined with Custom Fields, you can tag clients by plan type, revenue tier, account manager, or any other dimension that matters to your business.
Common Profitability Mistakes Agencies Make
After looking at the data and talking to agencies, the same patterns keep showing up.
- Custom everything: Custom pricing, custom scopes, custom onboarding for every client. It feels like premium service. It is actually margin destruction.
- Tool overload: Subscribing to 20+ tools because each one solves one problem. The hidden cost is not just the subscription fees. It is the hours lost to switching, syncing, and troubleshooting.
- No standardized delivery model: When every project is a snowflake, you cannot train new hires efficiently, predict timelines, or improve processes.
- Selling before understanding the cost to serve: Closing a client at $500 per month feels like a win. Until you realize it costs $550 to serve them. You are paying for the privilege of working.
Tools and Systems That Support Profit-First Agencies
Building a profitable agency requires the right infrastructure. Here is how to think about your tool stack in three layers.
Financial Tools
You need accounting software that tracks profitability by client and by service, not just total revenue. QuickBooks or Xero for bookkeeping, paired with a dedicated agency analytics layer for margin tracking.
Project and Resource Management
Time tracking and resource allocation tools help you monitor utilization, catch over-servicing early, and forecast capacity. Harvest, Toggl, or the task management built into your agency OS all work.
Delivery and Reporting Platforms
This is where the most consolidation opportunity exists. Instead of separate tools for listings, reviews, social, SEO, and reporting, a platform like Synup OS bundles these into one white-labeled system.
Mancini’s Sleepworld, a Synup agency partner, reported an increase of 2-3 million dollars in revenue impact just from localized campaigns through the platform. Woops saw a 20% revenue impact using Synup for profile personalization.
Conclusion
Agency profitability is about building systems that protect your margins at every stage of the client lifecycle.
Track the metrics that connect activity to profit. Standardize your pricing with productized plans. Consolidate your tools to eliminate waste. And make margin visibility a daily habit, not a quarterly surprise.
If you are ready to see how a centralized agency operating system can improve your profitability, book a Synup OS demo to see it in action.
FAQs
- What is a good profit margin for a marketing agency?
Most healthy agencies fall in the 15 to 25% net margin range. Specialists and niche agencies often reach 25 to 40%. If you are below 10%, you are likely underpricing, over-servicing, or carrying too much overhead.
- What is the difference between gross margin and net margin?
Gross margin measures what remains after direct delivery costs. Net margin is what remains after all expenses, including overhead, admin, marketing, and taxes. Both matter. Gross margin tells you if your services are profitable. Net margin tells you if your business is.
- How can I tell which clients are profitable?
Calculate the full cost to serve each client: team time, tool costs, freelancers, and a share of overhead. Compare that to what you charge. Rank clients from most to least profitable. You will almost certainly find surprises.