How to See Your Google Local Store Analytics
Gain end-to-end insights on your store’s online presence and its impact on your revenue.
In-store retail sales hit an all-time high of $3.2 trillion in 2020. This trend is also mirrored in online commerce. As customers’ purchase journey evolves, in-store retail has been left playing catch up with its digital counterpart. However, in-store analytics offers traditional retail brands the opportunity to better optimize customer journeys and drive increased in-store revenues with data.
With customers increasingly relying on the internet to discover and consume retail products, traditional retail models must adapt to a digital-first discovery journey that’s more aligned to customer expectations and needs. As a business owner, you can use Google Analytics to review data from searches of your business as well as visits. Google keeps track of all this data to help you build a more successful business.
In Google Analytics, store visits are estimated based on the number of customers who visit your location in a 30-day time frame after visiting your website. These visits are reported based on metrics via store visit reports. By learning how to access this information, you can see how your ads and other online marketing content are pushing customers to your physical location.
Use our guide below to get started reviewing these reports and applying changes to your business based on the information you receive.
Step 1:
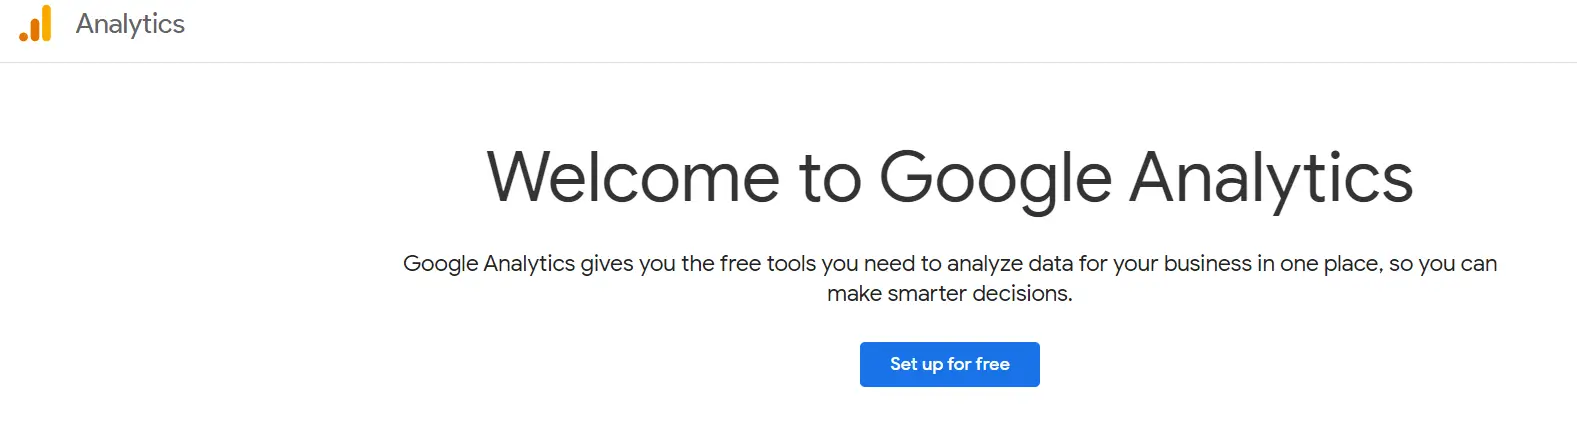
First, you need to sign into Google Analytics. Go to https://analytics.google.com/analytics/web/provision/#/provision to log in.
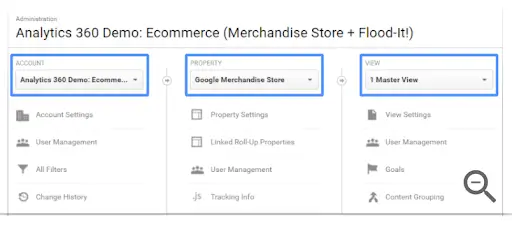
Next, you need to navigate to your view. To do this, click on Admin. Use the ACCOUNT|PROPERTY|VIEW menus to select your account, property and view the details.
Step 2:
Next, you need to open Reports to be able to view the information gathered via Google Analytics. Here you have the option to select the Overview, Channels, or Location report.
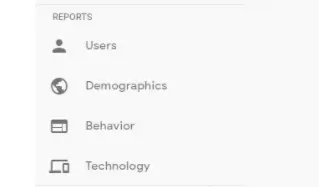
All report data is found on the left-hand side of the screen in Google Analytics. There is also a search box if you want to search for a specific report.
By selecting Overview, you have access to the percentage of website sessions that led to store visits. You also can see the number of store visits within the past 30 days. With Channels, the report shows you which channels were the most effective in driving traffic to your location. This includes email, paid search, etc. With the location report, you are provided insight into the location of the website search. This helps you to see which regions customers are coming from.
Step 3:
Now you are ready to review the data. After selecting your report type, you will see a breakdown in Google Analytics of your store visits and connected information. This includes the number of users, new users, sessions online, transactions, etc.

Be sure to read through each category of data. Pay attention to the region’s where users are buying the most online as well as offline. You may see a difference between the areas and can use this information when considering your return on ad spend.
Consider ad campaigns and how they affect users who are visiting your physical store location. What can you do to drive in more traffic? Continue to track your store-visit rates after promotions and invitations are sent out via marketing campaigns. Consider how these efforts increase your store traffic.
Continue to learn more about Google Analytics and how you can use the many tools available to build a more successful business. Use this information to build quality ad campaigns to boost online sales as well as foot traffic within your business.